Balance of Payments
International Investment Position
Balance of Payments
International Investment Position
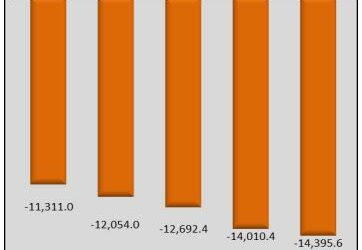
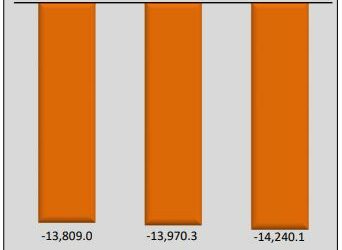
Fiji’s International Investment Position (IIP) statement provides a snapshot of the country’s international financial assets and liabilities. It measures the stock (or level) of Fiji’s financial assets and liabilities with the rest of the world at a particular point in time. Administrative and survey data have been used to compile the International Investment Position in accordance with the 6 th edition of the International Monetary Fund’s Balance of Payments Manual.
| 2013 | 2014 | 2015 | 2016 | 2017 | 2018 | 2019 | 2020 | 2021 [p] | |
| Total International Assets | 3,450.3 | 3,264.5 | 3,661.6 | 3,533.2 | 4,085.8 | 3,482.3 | 3,749.1 | 3,648.1 | 4,978 |
| Total International Liabilities | 8,934.2 | 10,061.3 | 10,792.2 | 11,300.7 | 12,524.4 | 13,626.3 | 15060.1 | 15702.1 | 17,652 |
| Net International Investment Position | -5,483.9 | -6,796.8 | -7,130.6 | -7,767.5 | -8,438.6 | -10,144.0 | -11311.0 | -12054.0 | -12,674.8 |
Latest Releases
Document Library
Balance of Payments
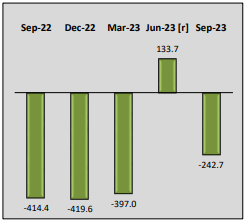
Fiji’s Balance of Payments (BOP) Statistics shows the value of Fiji’s transactions with the rest of the world
in goods, services, primary income, secondary income and capital accounts. It also shows changes in Fiji’s
financial claims on (assets) and (liabilities) to the rest of the world. The information used in this release is
from the International Investment Survey and Administrative sources.
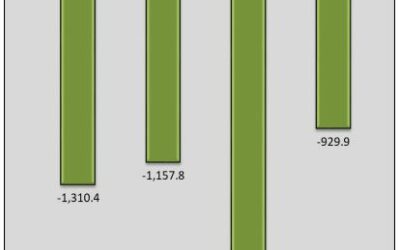
| 2017[p] | 2018 [p] | 2019 [p][r] | 2020 [p] | |
| Balance on Current Account | -743.4 | -980.6 | -1,498.3 | -1,309.9 |
|---|---|---|---|---|
| Balance on Capital Account | 9.1 | 10.4 | 6.9 | 7.7 |
| Capital Account Net Lending(+)/Net Borrowing(-) | -703.0 | -1,666.3 | -1,199.8 | -790.4 |