Business Statistics
Building and Construction
Aircraft Statistics
Wholesale Retail Trade
Industrial Production Index
Building and Construction
Building Statistics shows the number and value of permits and completion certificates issued during a period. The information is compiled using data supplied by the City and Town Councils.
| Period | Building Permits Issued [No.] | Building Permits Issued [Value] | Completion Certificates Issued [No.] | Completion Certificates Issued [Value] | Estimated Value of Work Put-in-Place |
| 2008 | 1,192 | 83,696 | 377 | 41,195 | 254,003 |
| 2009 | 1,119 | 101,861 | 347 | 64,586 | 250,260 |
| 2010 | 1,210 | 203,800 | 416 | 92,686 | 259,368 |
| 2011 | 1,324 | 166,141 | 465 | 111,411 | 257,080 |
| 2012 | 1,396 | 487,876 | 515 | 63,123 | 279,285 |
| 2013 | 1,412 | 199,169 | 506 | 54,594 | 360,346 |
| 2014 | 1,511 | 220,273 | 546 | 109,058 | 415,243 |
| 2015 | 1,612 | 226,624 | 532 | 103,294 | 466,677 |
| 2016 | 1,605 | 252,088 | 555 | 82,599 | 513,907 |
| 2017 | 1,618 | 353,196 | 588 | 126,060 | 540,377 |
| 2018 | 1,725 | 370,045 | 663 | 195,909 | 604,256 |
Latest Releases
Document Library
Aircraft Statistics
Aircraft statistics provides information on regular domestic and international operations by the local
airlines. Services provided by the air transport operators include, transport of passengers or freight by
air over regular routes and on regular schedules and non-schedule transport.
| Period | 2012 | 2013 | 2014 | 2015 | 2016 | 2017 | 2018 | 2019 |
| International Flights – Passenger | 749,831 | 979,542 | 1,033,869 | 1,102,620 | 1,154,158 | 1,293,382 | 1,375,883 | 1,369,209 |
| International Flights – Passenger** [000] km performed | 1,949,114 | 3,910,222 | 4,265,209 | 4,454,764 | 4,753,386 | 5,368,458 | 5,824,432 | 6,024,091 |
| International Flights – Seat* [000] km available | 5,462,695 | 5,182,725 | 5,237,142 | 5,391,682 | 6,931,153 | 7,560,371 | 7,800,387 | |
| Domestic Flights – Passenger | 260,093 | N/A | 258,298 | 270,088 | 250,195 | 282,027 | 294,314 | 331,084 |
| Domestic Flights – Passenger** [000] km performed | 34,657 | N/A | 46,204 | 48,174 | 44,433 | 49,835 | 53,095 | 59,330 |
| Domestic Flights – Seat* [000] km available | 74,195 | N/A | 74,126 | 59,425 | 62,612 | 64,627 | 73,411 | 80,203 |
Notes:
** Passenger-Kilometers refer to the sum of products obtained by multiplying the number of passengers carried on each flight by their stage distance .
* Seat Kilometers Available is the sum of products obtained by multiplying the number of seats available on each stage flight by the stage distance.
Latest Releases
Document Library
Wholesale Retail Trade
Aircraft statistics provides information on regular domestic and international operations by the local
airlines. Services provided by the air transport operators include, transport of passengers or freight by
air over regular routes and on regular schedules and non-schedule transport.
| 2013 | 2014 | 2015 | 2016 | 2017 | 2018 | 2019 | 2020 | |
| Stock | 391,392 | 402,595 | 424,484 | 435,320 | 442,921 | 458,263 | 472,871 | 471,236 |
| Sales | 3,289,937 | 3,498,719 | 3,664,827 | 3,853,827 | 3,957,074 | 4,162,074 | 4,387,170 | 4,297,938 |
Latest Releases
Document Library
Industrial Production Index
[Base: Average 4 quarters 2005 = 100]
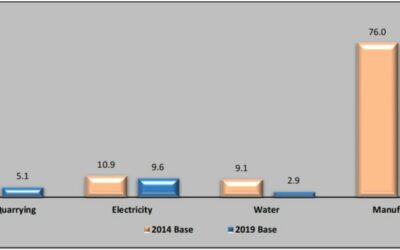
The Industrial Production Index (IPI) is an economic indicator that measures production volume changes
in the following industries; Mining and Quarrying, Manufacturing, Electricity and Water.
| Commodities | Weights | 2014 | 2015 | 2016 | 2017 | 2018 | 2019 | 2020 | 2021 | 2022 |
| Mining & Quarrying | 4.0 | 100.0 | 100.9 | 106.8 | 90.6 | 81.5 | 77.7 | 75.2 | 70.6 | 61.4 |
| Frozen poultry/Meat/Canned Fish | 5.1 | 100.0 | 146.1 | 137.6 | 145.4 | 148.7 | 154.8 | 160.6 | 151.8 | 154.2 |
| Fruit and vegetables | 0.6 | 100.0 | 104.8 | 100.2 | 100.8 | 103.8 | 104.9 | 71.9 | 40.5 | 39.9 |
| Sugar | 6.2 | 100.0 | 107.2 | 84.1 | 88.3 | 60.8 | 66.7 | 53.4 | 50.4 | 67.8 |
| Soft drinks/Mineral water/Yaqona/Tobacco | 15.8 | 100.0 | 116.2 | 137.1 | 141.1 | 165.1 | 149.1 | 133.8 | 161.2 | 176.4 |
| Wearing apparel | 7.5 | 100.0 | 90.4 | 82.0 | 94.6 | 100.0 | 86.4 | 72.1 | 62.9 | 58.9 |
