Prices
Consumer Price Index
Producer Price Index
International Merchandise Trade Index
Building Material Price Index
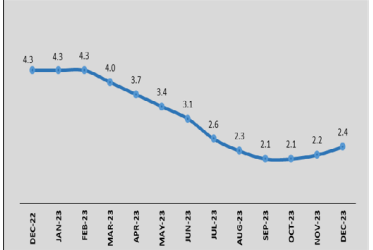
Consumer Price Index
The Consumer Price Index [CPI] is compiled to indicate average changes in the prices of goods and services purchased by households nationwide with monthly price collections carried out in the urban areas [Suva, Lami, Nasinu, Nausori, Lautoka, Nadi, Ba and Labasa]. The index is currently taken to represent price changes in the rural areas as well. The CPI weights are derived from the Household Income and Expenditure Survey [HIES] of 2013/2014.
[Base: Average 12 months 2014 = 100.0]
| Year | CPI |
| 2015 | 101.4 |
| 2016 | 105.3 |
| 2017 | 108.8 |
| 2018 | 113.3 |
| 2019 | 115.3 |
| 2020 | 112.3 |
| 2021 | 112.5 |
| 2022 | 117.3 |
Latest Releases
Document Library
Producer Price Index
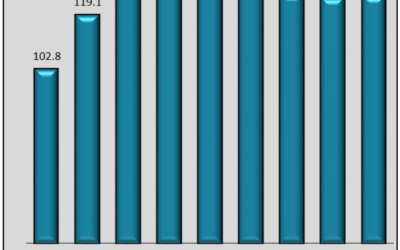
The Producer Price Index (Goods) measures the average change over time in the prices received by domestic producers of goods, that is, the prices of goods as and when they leave the factory or the producers’ premises. Information contained in this release are used to estimate Gross Domestic Product at Constant Prices.
[Base: Average 4 quarters 2019 = 100.0]
| Description | 2011 | 2012 | 2013 | 2014 | 2015 | 2016[p] | 2017[p] |
| MINING AND QUARRYING | 107.8 | 113.9 | 106.6 | 99.0 | 96.1 | 98.7 | 97.0 |
| MANUFACTURING | 103.3 | 109.3 | 113.2 | 116.6 | 116.0 | 117.3 | 117.3 |
| ELECTRICITY, GAS, STEAM & AIR CONDITIONING SUPPLY AND WATER COLLECTION, TREATMENT & SUPPLY | 103.1 | 104.1 | 99.9 | 99.9 | 99.9 | 107.9 | 107.9 |
| ALL ITEMS * | 103.0 | 108.8 | 110.9 | 113.0 | 112.4 | 114.5 | 114.6 |
Latest Releases
Document Library
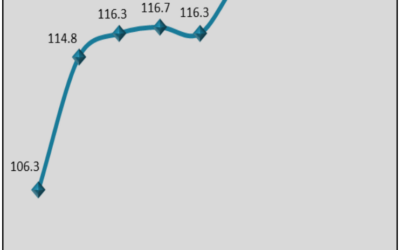
Building Material Price Index
The Producer Price Index (Goods) measures the average change over time in the prices received by domestic producers of goods, that is, the prices of goods as and when they leave the factory or the producers’ premises. Information contained in this release are used to estimate Gross Domestic Product at Constant Prices.
[Base: Average 4 Quarters 2014 = 100.0]
| All Items | Wood and Related Materials | Cement and Related Materials | Iron and Steel | Plumbing ware | Paint and Glass | Floor and Wall Tiles | Door and Window Frames | Electrical Products | |
| 2014 | 100.0 | 100.0 | 100.0 | 100.0 | 100.0 | 100.0 | 100.0 | 100.0 | 100.0 |
| 2015 | 103.4 | 101.5 | 103.3 | 101.9 | 109.7 | 105.9 | 98.1 | 102.5 | 104.6 |
| 2016 | 98.8 | 95.8 | 97.6 | 98.9 | 104.7 | 104.8 | 91.4 | 100.8 | 101.7 |
| 2017 | 99.2 | 97.6 | 99.2 | 96.7 | 98.3 | 103.6 | 91.6 | 101.7 | 102.3 |
| 2018 | 101.4 | 100.5 | 102.4 | 98.5 | 98.4 | 100.1 | 90.7 | 101.7 | 106.3 |
| 2019 | 102.6 | 103.5 | 104.2 | 98.6 | 100.0 | 96.0 | 90.0 | 101.7 | 108.8 |
| 2020 | 104.3 | 106.6 | 107.3 | 99.6 | 96.5 | 95.4 | 85.8 | 101.7 | 110.6 |
| 2021 | 104.8 | 113.1 | 108.9 | 98.8 | 92.6 | 96.7 | 85.5 | 101.7 | 104.8 |
| 2022 | 118.4 | 117.3 | 132.9 | 101.3 | 103.3 | 104.1 | 85.7 | 101.7 | 103..0 |
Latest Releases

Document Library
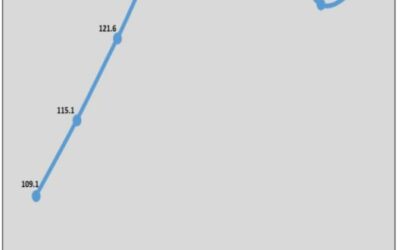
International Merchandise Trade Index
The Terms of Trade [TOT] is a ratio of two price indexes: one for exports and the other for imports. A rise in
the index means that Fiji can buy more imports from the same amount of exports.
| 2019 | 2020 | 2021 | 2022 | |
| Export Price Index – All Items | 100.0 | 97.1 | 100.1 | 113.1 |
| Import Price Index – All Items | 100.0 | 91.8 | 96.3 | 107.1 |
| Terms of Trade | 100.0 | 105.8 | 104.0 | 105.6 |
![INTERNATIONAL MERCHANDISE TRADE INDEXES [PRICES] – March Quarter 2024](https://wordpress-262730-3525888.cloudwaysapps.com/wp-content/uploads/et_temp/IMTI_March_2024-51884_400x250.png)
![INTERNATIONAL MERCHANDISE TRADE INDEXES [PRICES] – Annual 2023](https://wordpress-262730-3525888.cloudwaysapps.com/wp-content/uploads/et_temp/IMTI_Annual_2023-32250_400x250.jpg)