Population and Demographic Indicators
Population Indicators by Censuses
Population Pyramid
Population by Religion
Population Grids
Population Indicators by Censuses
| Census Dates | Total Population | Growth Rate |
| 1891 5-Apr | 121,180 | -0.5 |
| 1901 31-Mar | 120,124 | -0.1 |
| 1911 2-Apr | 139,541 | 1.5 |
| 1921 24-Apr | 157,266 | 1.2 |
| 1936 26-Apr | 198,379 | 1.6 |
| 1946 2-Oct | 259,638 | 2.7 |
| 1956 26-Sep | 345,737 | 2.9 |
| 1966 12-Sep | 476,727 | 3.3 |
| 1976 13-Sep | 588,068 | 2.1 |
| 1986 31-Aug | 715,375 | 2 |
| 1996 25-Aug | 775,077 | 0.8 |
| 2007 16-Sep[p] | 837,271 | 0.7 |
| 2017 17-Sep | 884,887 | 0.6 |
Population Pyramid
A Population Pyramid showing Fiji’s age-sex structure as at Census Night 2017. The broad base of the structure indicates a population that is young with 10.4 percent of the population under five years of age while 16.7% are in the youth age group of 15-24.
| Age-Group | Male | Female |
| 0 – 4 | 47,195 | 44,702 |
| 5 – 9 | 45,243 | 43,052 |
| 10-14 | 40,715 | 38,881 |
| 15 -19 | 38,032 | 36,056 |
| 20 -24 | 37,464 | 36,152 |
| 25 – 29 | 35,253 | 34,055 |
| 30 – 34 | 35,266 | 33,552 |
| 35 – 39 | 33,382 | 31,768 |
| 40 – 44 | 27,697 | 25,817 |
| 45 – 49 | 25,314 | 24,190 |
| 50 – 54 | 24,649 | 23,961 |
| 55 – 59 | 21,263 | 20,745 |
| 60 – 64 | 14,891 | 15,724 |
| 65 – 69 | 10,076 | 11,252 |
| 70 – 74 | 6,367 | 7,781 |
| 75+ | 5,788 | 8,604 |
Population by Religion
| Religion | 1996 PHC | 2007 PHC |
| Christian | 443,157 | 539,536 |
| Anglican | 6,325 | 6,313 |
| Assembly of God | 31,072 | 47,778 |
| Catholic | 69,320 | 76,433 |
| Methodist | 280,628 | 289,923 |
| 7th Day Adventist | 22,187 | 32,308 |
| Hindu | 261,097 | 233,393 |
| Sikh | 3,076 | 2,577 |
| Muslim | 54,323 | 52,520 |
| Other Religion | 1,039 | 2,172 |
| No Religion | 5,132 | 7,073 |
Population Grids
A population grid, in the context of geographic information systems (GIS) and spatial analysis, refers to a spatial data representation of population data that is organized in a grid or raster format. This format divides a geographic area into a regular grid of cells or pixels, where each cell contains information about the population residing within that cell. Statistical population grid data are statistics geographically referenced to a system of (usually squared) grid cells in a grid net with Cartesian coordinates 1 . Population grids are powerful tools for studying the interrelationships between human activities and the environment 2 . Population grids are a valuable tool for various applications, including demographic analysis, urban planning, disaster management, and resource allocation.
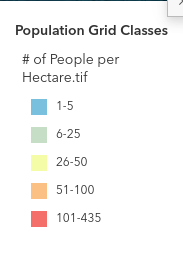 |
Shows the Fiji Population Grid overlaid with the Satellite Imagery. Source: Earthstar Geographics | Esri, HERE, Garmin, FAO, NOAA, USGS | Fiji Bureau of Statistics (FBOS) |
Click here to access the Story Map.